
Below is our recent interview with Gregory Shore, CEO at Crystal Shore:

Q: Gregory, let’s start with your background. What were you doing before Crystal Shore Dashboards?
A: Before Crystal Shore I was working in the money management industry, primarily for Merrill Lynch and ING. At Merrill Lynch, I was leading a 6-man team overseeing about 500 million USD of client assets. At ING, as a Chief Investment Officer, I was overseeing 200 investment professionals and roughly 90 billion USD of client assets.
If we go further back in time, I was deeply immersed in the academic world and the gaming world. My academic work at Chicago focused on theories of strategy and specific applications of game theory. On the gaming side, while working on my Ph.D., I was earning my income as a semi-pro backgammon player, playing both money games and tournaments in the US and Europe. My financial backers for tournament play were a group of traders on the CBOE [Chicago Board Options Exchange].
If you’re a semi-pro backgammon player with a passion for strategy, then there really is no better place to go than financial markets. So that’s where I went.
Q: Could you provide our readers with a brief introduction to Crystal Shore Dashboards?
A: Crystal Shore Dashboards emerged from my longstanding interest in systematic investment strategies. The money management industry is a peculiar industry: it is filled with smart, dedicated and passionate individuals who work long hours. But collectively, these professionals are hard pressed to deliver outperformance for their clients. Numerous studies demonstrate that the majority of money managers underperform the market. This is, of course, problematic.
So what can we do? Well, one avenue that offers some hope is to put aside the vagaries of human judgment and to explore systematic strategies. So these are strategies that can be designed, tested, and developed on very large data sets using the processing power of computers. I always felt there were very few individuals on this planet who can out-think financial markets. They exist but they are as rare as unicorns. So I always felt that a systematic approach to markets offered the best hope for delivering value, be it on the risk management side or the performance delivery side.
Crystal Shore Dashboards develops a great number of systematic strategies that are deployed across a very large number of global markets. The primary objective is to improve the management of risk by limiting the possibility of capital loss. But by limiting the risk of capital loss, we can materially improve the overall performance delivery versus the underlying markets, which is our second objective.
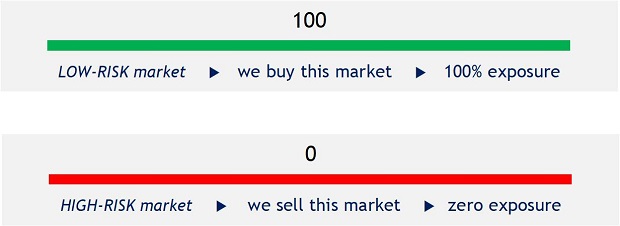
All of the output of our systematic strategies is uploaded into our two dashboards on a weekly basis. The dashboards provide a roadmap for navigating global markets, clearly separating the low risk markets from the high risk markets. We then sell these dashboards on a subscription basis to professional money managers on a pay-as-you-go basis. So that’s really the core of our business: we want to provide some help—some assistance—to professional money managers in the overall management of their assets.
 Recommended: An Interview With CBDfx Marketing Team
Q: How exactly do you evaluate global markets?
A: We always start with our number one objective: how can you reduce the risk of capital loss? Traditionally, investment risk is analyzed by calculating the volatility—or the variance, or the standard deviation—of the returns that are generated by some asset or market. So you’re basically applying a fairly simple mathematical formula to historical price data.
We also focus on historical price data. That’s actually all we look at. But we then break down this price data using a multitude of factors: valuation factors, momentum factors, risk factors… When you have a multitude of factors all working together for one common objective then you have, in effect, a dedicated investment strategy. One that can be executed systematically in a computer. These are the strategies that we build.
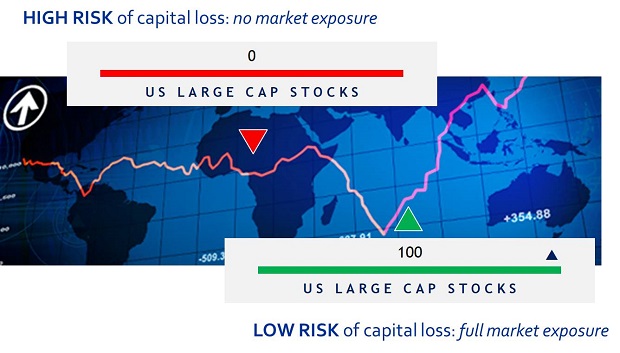
So we are working in a very specific space: historical price data. And by focusing on historical price data, our overarching goal is to quantify market risk. Which for us, once again, means the risk of capital loss. So that’s how we evaluate global markets: we build multi-factor, systematic strategies that quantify market risk.
Now of course, once you have a view on market risk, you can navigate global markets in such a way as to avoid the high risk markets while favoring the low risk markets. So you will reduce your probability of losing capital. And this will, more often than not, significantly boost your overall performance delivery. Not all of the time. But most of the time. So it may actually put you in a position to outperform the underlying markets that you are investing in. Which is, of course, the holy grail of every money manager.
Q: We could say that your company is part fintech, right? What makes that tech part?
A: Yes indeed, we are very much in the fintech space because all of our investment strategies are designed, tested, developed and managed in our computers. Furthermore, we did not develop our strategies on some off-the shelf, ready-for-installation, investment, trading or research platform, of which there are quite a few. Rather, we designed and built the entire platform on which we develop and test our strategies. So we built the machine on which we build our machines: the investment engines that run our investment strategies. And all of the programming was done in-house.
Q: Who are your clients and which markets are you targeting?
A: Our clients are professional money managers and they can be anywhere in the world: Europe, Asia, Africa, the Middle East and the Americas. There are professional money managers hard at work on all of these continents and across all of these regions. We’re talking about fund managers, institutional asset managers, wealth managers, private banks, family offices, IFA teams, foundations, insurance companies, brokers, dealers, traders, pension funds, sovereign wealth funds and even hedge funds, because one of our two dashboards—GTS—works on a long-short basis.
So here, with GTS, we’re not just trying to protect capital in falling markets but we’re actually trying to generate profits in falling markets. This is unusually difficult work. Very, very challenging. But we enjoy working on the short side. Few things in life generate as much pleasure as a successful short sale!
In terms of our targeting, we seek out professional money managers who have an investment focus on markets and assets. As opposed to individual securities, like individual stocks and bonds. We have absolutely nothing to say about individual stocks and bonds. So don’t ask me for our view on Tesla: we don’t have one!
Surprisingly, this is where most investment research is focused: picking winning stocks. I say it’s surprising because, mathematically, it is much harder to predict the future direction of a single stock than the future direction of a broad market, like the S&P 500. With the single stock—like Tesla—you have just one data point. What can you do with one data point?
We’re based in the Swiss Alps [Crystal Shore Dashboards is based in the ‘Espace Création’, a start-up incubator in the city of Sion, Canton of the Valais]. Imagine you’re standing on the top of one of the many mountains in our neighborhood and you send one billiard ball rolling down the hill: can you predict where this billiard ball will end up?
But with the S&P 500, you have 505 data points [there are 505 companies in the S&P 500]. It’s a world of a difference: 500 times more data gives you massively more robust predictions. So going back to our Swiss mountain: if you’re going to send 500 billiard balls rolling down the mountain, you can build a pretty good model that will predict where the great majority of them will end up.
So we don’t do any work on individual securities, be they stocks or bonds. At all. Our focus is always on broad markets and key asset classes: US Mid-Caps, the Chinese stock market, the UK stock market, the Asian Real Estate market, Commodities, Precious Metals, High Yield, and so on.
So our work is targeted at those money managers who seek to create value by working across global markets and assets. To express this differently: the investment vehicle of choice for our work is the ETF [Exchange Traded Fund]. Our two dashboards—GTR and GTS—are tailor-made for managing a portfolio of ETFs. But if you have grounded your portfolio management exclusively or predominantly in stock-picking, then we cannot help you much.
 Recommended:
 Q: What’s next for Crystal Shore? Do you have plans to grow, expand or diversify?
A: We go through periods of system development and periods of business development. I realize that a lot of companies—definitely most big companies—are doing both at the same time. But for us, it has always been impossible: the mindset is so completely different. And once you go back and kick-start the development and the design of new investment strategies, it consumes all of your brainpower, day and night. And it’s this total immersion which creates the space for generating new insights. And these new insights often become the driver of key breakthroughs in system development. So yeah, I get weeks behind on my emails when I’m into system development. Because the focus on design and development becomes all-consuming.
We’re just emerging from half a year’s development work on our investment systems, our dashboards and our website. A lot of this work was a response to the extensive feedback we got from our business development in 2018. This must be a familiar pattern to a lot of the young companies that you talk to at SuperbCrew: you build a product. You take it to the market. You then get a whole lot of feedback from a great number of companies. And then you go back to the office and develop and shape the product in a way that better matches the needs and aspirations of the companies that you just talked to. So it’s an iterative process.
We feel that our systems and our dashboards are getting pretty close to where they should be. We now offer long-only and long-short, we have a 4 year track record, our numbers can be absolutely and perfectly replicated in the real world, the market views that we distribute are ridiculously clear and straightforward, we match the market risk scores with an extensive ETF database, real-world portfolio implementation has been greatly simplified and we have huge confidence in the 220 investment engines that we are now running across our 55 global markets.
So yeah, we really feel that for any professional money management team that wants to get a clear picture of market risk. And for any investment team looking for an independent performance generator that they can basically click on to their own proprietary investment process. Then we have something special.
Activate Social Media: