
OfficeReports is a reporting package build in into Microsoft Office. It is the only advanced reporting package which can handle the whole process from data to PowerPoint presentation from within Microsoft Office. Below is our interview with Fred Balkenende, Co-founder of OfficeReports:

Q: How would you describe OfficeReports in your own words?
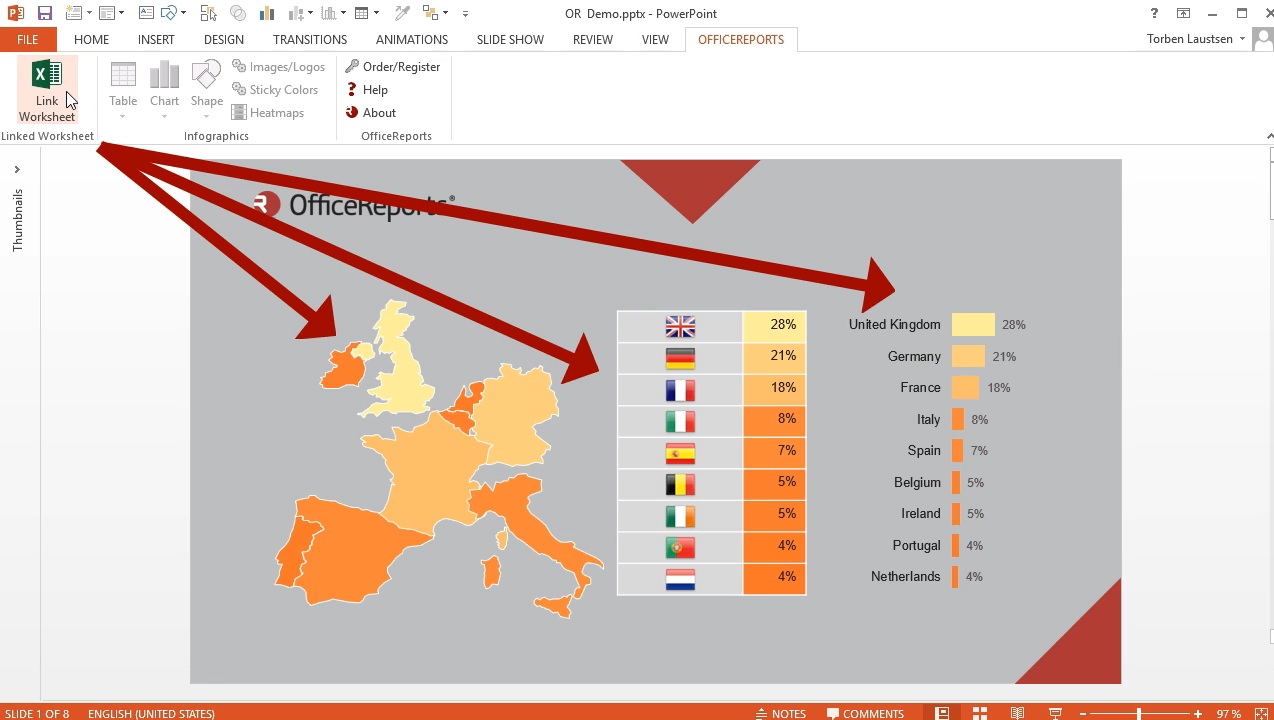
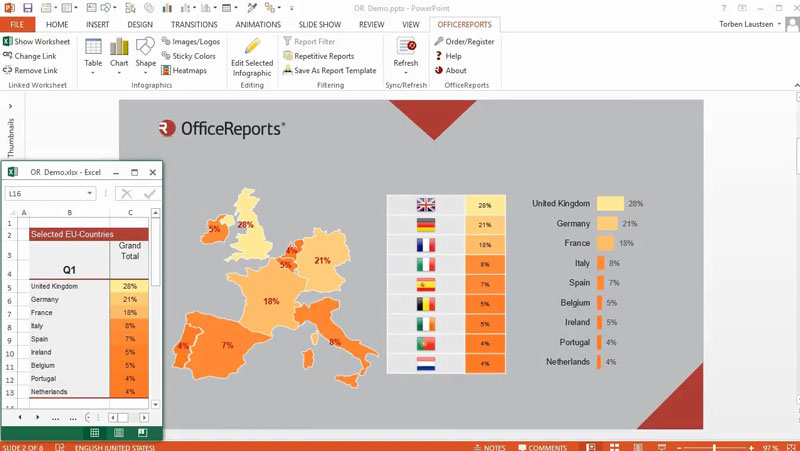
A: OfficeReports is a reporting package build in into Microsoft Office. In Excel, OfficeReports adds an ‘Analytics’ menu for creating charts and tables from datasets, and in PowerPoint we now have our new ‘Link’ menu for linking Excel data to PowerPoint tables charts and shapes. ‘Link’ and ‘Analytics’ are 2 different products which can be used separately. So you can use ‘Link’ to link any data in Excel.
 Recommended: Sezzle Is Raising The Bar For Consumer To Business Payment Processing
Q: What advantage does OfficeReports have over its competitors?
A: OfficeReports is the only advanced reporting package which can handle the whole process from data to PowerPoint presentation from within Microsoft Office. By being a part of Office, we can skip a lot of exporting, copying and pasting. Our new ‘Link’ menu also offers functionality we not yet have seen in any other product.
 Recommended: PhoeniX Software Brings Integrated Photonic Solutions From A Concept Into A Manufacturable Design
Q: You’ve recently launched new tool for turning Excel data into PowerPoint infographics; tell us something more?
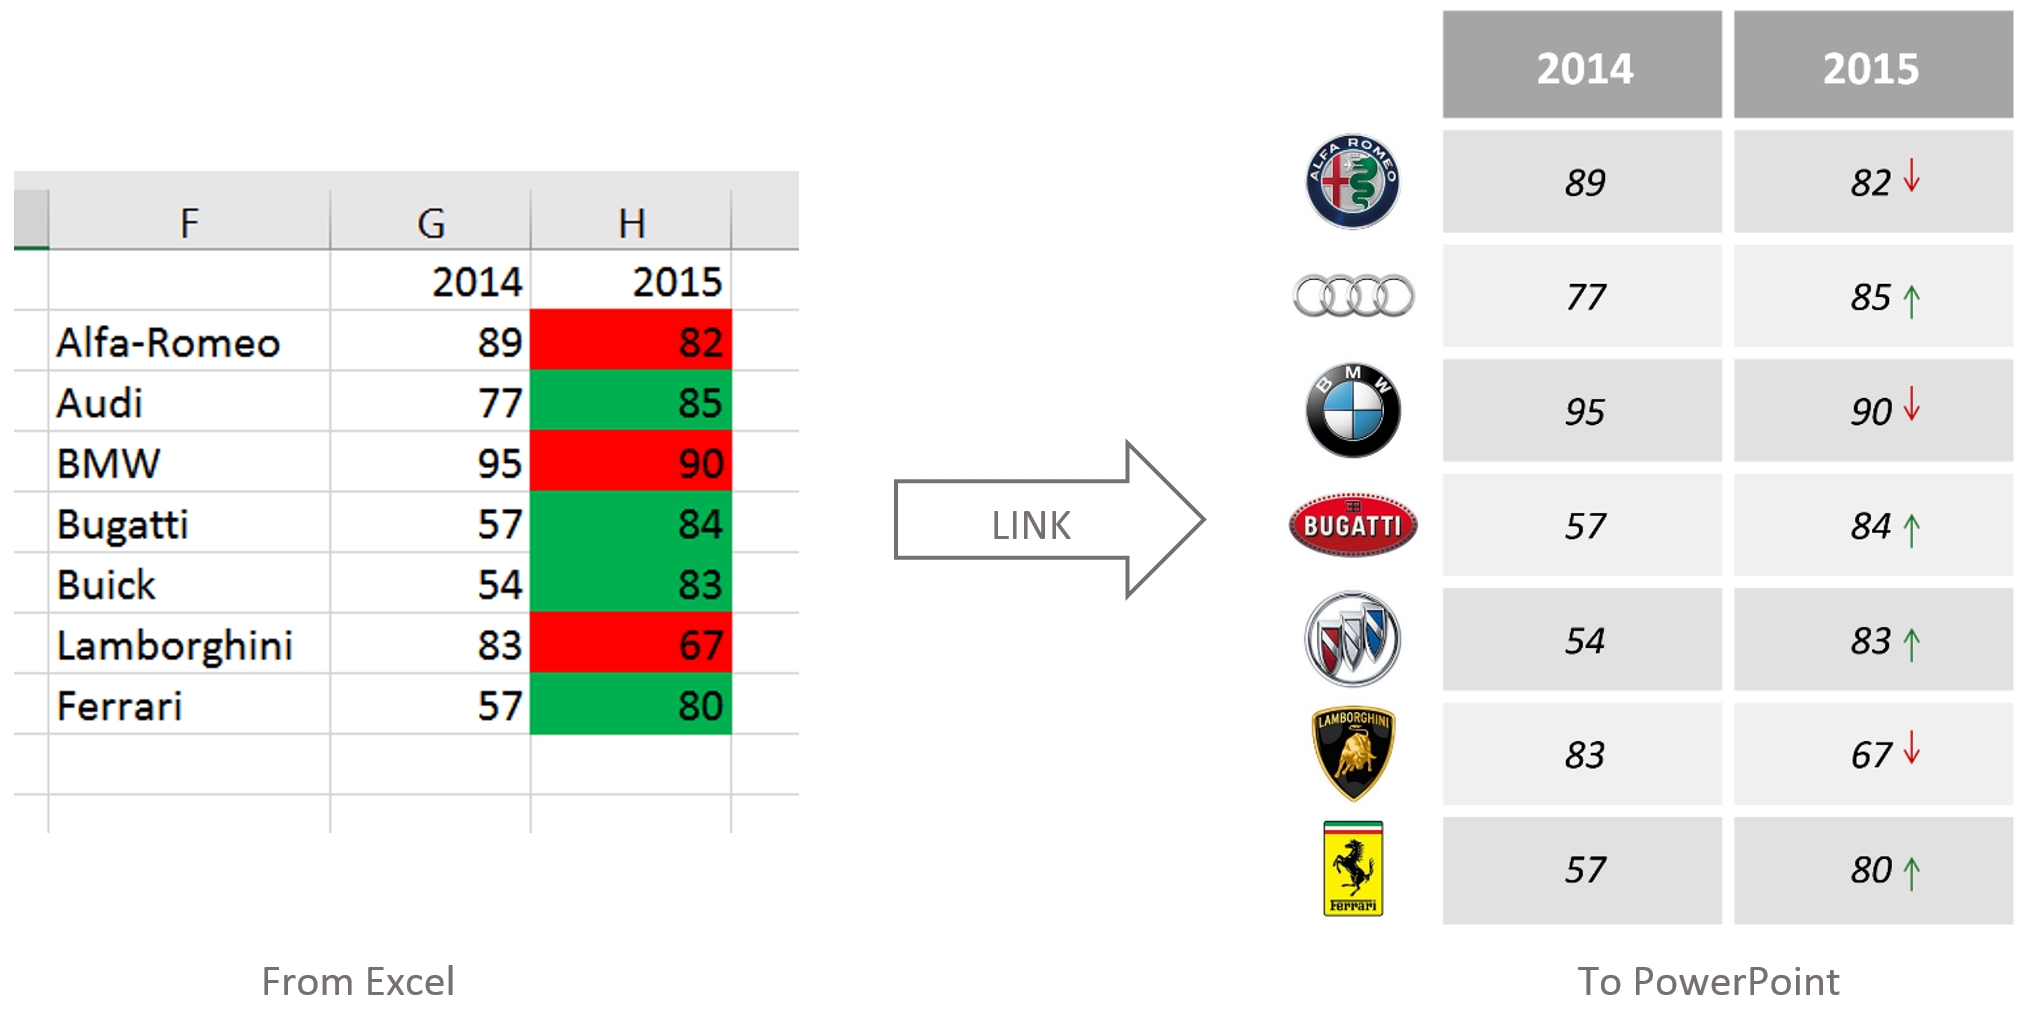
A: A lot of tables and charts in PowerPoint are populated with data which originates from Excel. The advantage of linking the PowerPoint charts and tables directly to the Excel data is that we automatically can update the presentation as the data in Excel changes. Using Microsoft’s own linking functionality (OLE) is a pain to work with, and does not deliver the same high quality layout as native PowerPoint tables and charts do. That is why we decided to develop our own linking functionality. The result of it has some unique functionality:
· Link the background colors from Excel, even from ‘conditional formatting’
· Link specific texts in Excel as logos in PowerPoint (tables, charts and shapes)
· Link specific background colors as icons in PowerPoint (tables, charts and shapes)
· Specific texts from Excel can be visualized in specific colors in PowerPoint (‘Sticky Colors’)
· Linking Excel data, font and colors to PowerPoint shapes, so you e.g. can control maps in PowerPoint with your Excel data
· Macro Integration
 Recommended: Quikly & The Evolution Of Consumer Marketing
Q: Could you tell us more about your pricing plans?
A: OfficeReports is compared to our competitors very reasonably priced. The basic ‘Link’ menu can be used from $69 per seat, while the ‘Pro’ version for complete report automation costs $299.
Q: What can we expect from OfficeReports in next six months?
A: We will make it possible to have a presentation automatically update itself every few minutes, so it will be possible to create ‘live dashboards’ in a PowerPoint presentation. We will also add support for the new chart types in Office 2016 like the Waterfall, Sunburst, Treemap and Mekko charts.
Activate Social Media: